Installing Grafana
- Learn how to install Grafana and access the powerful Grafana UI
- This tutorial focuses on installing Grafana as a standalone instance
The following will walk you through how to install and configure Grafana. This should NOT be installed on a Couchbase node, but rather on a standalone server in the same network as your Couchbase cluster.
Configure Yum
Add a new file to your YUM repository using the method of your choice.
sudo vi /etc/yum.repos.d/grafana.repoAdd the following to the file and save it.
[grafana]
name=grafana
baseurl=https://packages.grafana.com/oss/rpm
repo_gpgcheck=1
enabled=1
gpgcheck=1
gpgkey=https://packages.grafana.com/gpg.key
sslverify=1
sslcacert=/etc/pki/tls/certs/ca-bundle.crt
If you would like to install using rpm visit https://grafana.com/docs/grafana/latest/installation/rpm/
Install Grafana with Yum
sudo yum install grafana -yInstall Grafana Binaries
These steps will install binaries in /usr/sbin/grafana-server:
- Installs default file (environment vars) to
/etc/sysconfig/grafana-server - Copies configuration file to
/etc/grafana/grafana.ini - Installs systemd service (if systemd is available) name
/usr/lib/systemd/system/grafana-server.service - The default configuration uses a log file at
/var/log/grafana/grafana.log - The default configuration specifies an sqlite3 database at
/var/lib/grafana/grafana.db
Reload systemd and Start Grafana
Reload the systemd service to register the grafana service and start the grafana service.
sudo systemctl daemon-reload
sudo systemctl start grafana-server
Check the grafana service status using the following command.
sudo systemctl status grafana-serverConfigure grafana to start at boot
sudo systemctl enable grafana-server.serviceAccess Grafana UI
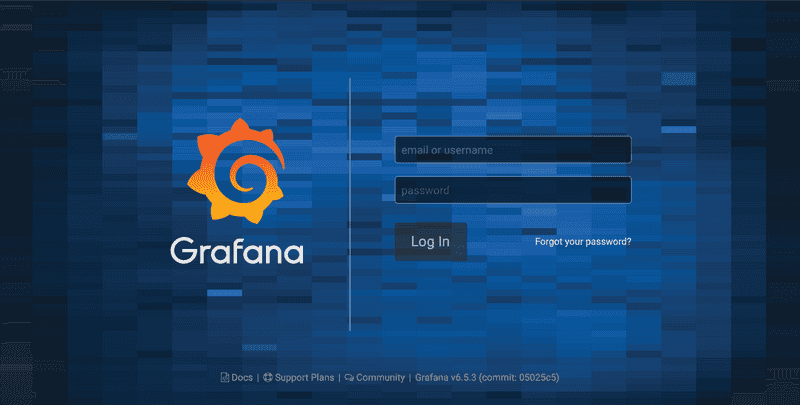
Now you will be able to access the Grafana UI on port 3000 of the server.
http://<grafana-ip>:3000You should be able to see the following UI as shown below.
The default user and password is admin, you will be prompted to change this but you are not required to.
