Configure Prometheus Alerts
- Learn how to create and configure rules to send effective alerts
- Work with our example rules to get an understanding of how rules work, then write rules that are custom-tailored to your application
- See your rules in action with the Prometheus UI
Configure Prometheus to use AlertManager
Edit the prometheus.yml file from the server that Prometheus is installed on and add the following YAML below the global: block and before the scrape_configs: block.
sudo vi /etc/prometheus/prometheus.yml# Alertmanager configuration
alerting:
alertmanagers:
- static_configs:
- targets:
- <alertmanager-ip>:9093
scheme: http
timeout: 10sConfigure Prometheus to Monitor AlertManager
Edit the prometheus.yml file and add the following under the scrape_configs: block.
sudo vi /etc/prometheus/prometheus.yml - job_name: alertmanager
honor_labels: true
honor_timestamps: true
scheme: http
scrape_interval: 60s
scrape_timeout: 55s
metrics_path: /metrics
static_configs:
- targets: ['localhost:9093']Restart Prometheus
sudo systemctl restart prometheusCreate Prometheus Rules
Create a rules directory for Prometheus to reference.
sudo mkdir -p /etc/prometheus/rulesCopy all of the example rules into the directory:
sudo cp /opt/couchbase_exporter/prometheus/rules/*.yml /etc/prometheus/rulesSet the permissions so that the prometheus user is the owner.
sudo chown -R prometheus:prometheus /etc/prometheus/rulesVerify that all of the rules are valid by using promtool
promtool check rules /etc/prometheus/rules/*.ymlThe output should show SUCCESS for all rules files, similar to the following:
Checking /etc/prometheus/rules/couchbase.analytics.rules.yml
  SUCCESS: 2 rules found

Checking /etc/prometheus/rules/couchbase.bucket.rules.yml
  SUCCESS: 10 rules found

Checking /etc/prometheus/rules/couchbase.eventing.rules.yml
  SUCCESS: 2 rules found

Checking /etc/prometheus/rules/couchbase.fts.rules.yml
  SUCCESS: 2 rules found

Checking /etc/prometheus/rules/couchbase.index.rules.yml
  SUCCESS: 2 rules found

Checking /etc/prometheus/rules/couchbase.query.rules.yml
  SUCCESS: 4 rules found

Checking /etc/prometheus/rules/couchbase.system.rules.yml
  SUCCESS: 4 rules found

Checking /etc/prometheus/rules/couchbase.xdcr.rules.yml
  SUCCESS: 4 rules found
Configure Prometheus Rules
The rules files exist, now prometheus needs to be configured to use them. Add the following YAML after the alerting: block and before the scrape_configs: block.
# Load rules once and periodically evaluate them according
# to the global evaluation_interval.
rule_files:
  - "rules/couchbase.*.rules.yml"
sudo vi /etc/prometheus/prometheus.ymlValidate the configuration changes using promtool
promtool check config /etc/prometheus/prometheus.ymlRestart Prometheus so the configuration change is picked up.
sudo systemctl restart prometheusAccess Prometheus UI
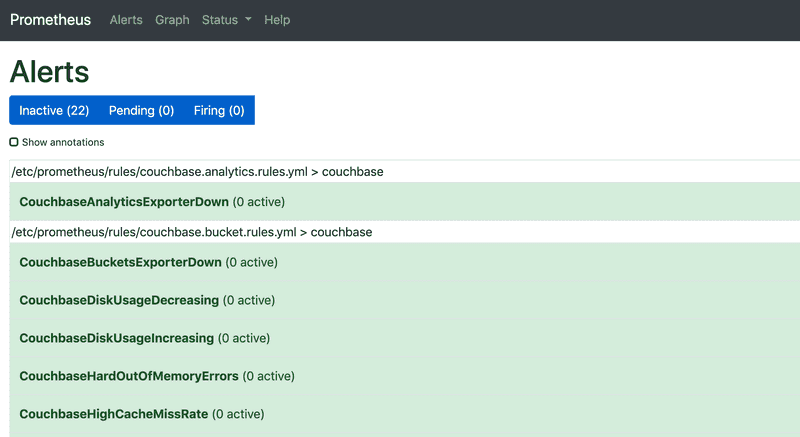
Open the Prometheus UI and go to the "Alerts" tab.
http://<prometheus-ip>:9090/alertsYou should be able to see all of the configured alerts in the UI.
Disclaimer: The rules that have been provided are for example purposes only. Alerts should be configured and tailored specific to your use-case and environments. Please review the documentation for adding your own custom Prometheus alerting rules.
