Configure Prometheus AlertManager
- Learn how to install and configure AlertManager to handle alerts sent by the Prometheus server
- View detailed configuration examples and set up a test alert to ensure functionality
It is important to know that Prometheus can support multiple AlertManagers for High-Availability by specifying more than 1 alertmanager target. For the purpose of this tutorial, we will install a single AlertManager on the same server as Prometheus and Grafana.
Download Prometheus AlertManager
Download the AlertManager binary to the server that you will use for alerting.
wget \
  https://github.com/prometheus/alertmanager/releases/download/v0.21.0/alertmanager-0.21.0.linux-amd64.tar.gz
Visit the Prometheus downloads page for the latest version.
Create User
Create a Prometheus user, required directories, and make prometheus user as the owner of those directories.
sudo groupadd -f alertmanager
sudo useradd -g alertmanager --no-create-home --shell /bin/false alertmanager
sudo mkdir -p /etc/alertmanager/templates
sudo mkdir /var/lib/alertmanager
sudo chown alertmanager:alertmanager /etc/alertmanager
sudo chown alertmanager:alertmanager /var/lib/alertmanager
Unpack Prometheus AlertManager Binary
Untar and move the downloaded Prometheus AlertManager binary
tar -xvf alertmanager-0.21.0.linux-amd64.tar.gz
mv alertmanager-0.21.0.linux-amd64 alertmanager-files
Install Prometheus AlertManager
Copy alertmanager and amtool binary from prometheus-files folder to /usr/bin and change the ownership to prometheus user.
sudo cp alertmanager-files/alertmanager /usr/bin/
sudo cp alertmanager-files/amtool /usr/bin/
sudo chown alertmanager:alertmanager /usr/bin/alertmanager
sudo chown alertmanager:alertmanager /usr/bin/amtool
Install Prometheus AlertManager Configuration File
Move the alertmanager.yml file from alertmanager-files to the /etc/alertmanager folder and change the ownership to alertmanager user.
sudo cp alertmanager-files/alertmanager.yml /etc/alertmanager/alertmanager.yml
sudo chown alertmanager:alertmanager /etc/alertmanager/alertmanager.yml
Setup Prometheus AlertManager Service
Create an alertmanager service file.
sudo vi /usr/lib/systemd/system/alertmanager.serviceAdd the following configuration and save the file
[Unit]
Description=AlertManager
Wants=network-online.target
After=network-online.target

[Service]
User=alertmanager
Group=alertmanager
Type=simple
ExecStart=/usr/bin/alertmanager \
    --config.file /etc/alertmanager/alertmanager.yml \
    --storage.path /var/lib/alertmanager/

[Install]
WantedBy=multi-user.target
sudo chmod 664 /usr/lib/systemd/system/alertmanager.serviceReload systemd and Register Prometheus AlertManager
Reload the systemd service to register and Start the Prometheus AlertManager service.
sudo systemctl daemon-reload
sudo systemctl start alertmanager
Check the alertmanager service status using the following command.
sudo systemctl status alertmanagerConfigure Prometheus AlertManager to start at boot
sudo systemctl enable alertmanager.serviceIf firewalld is enabled and running, add a rule for port 9093
sudo firewall-cmd --permanent --zone=public --add-port=9093/tcp
sudo firewall-cmd --reload
Access Prometheus AlertManager UI
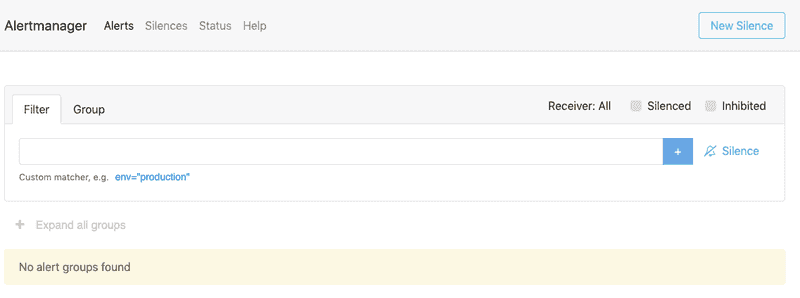
Now you will be able to access the AlertManager UI on 9093 port of the alertmanager server.
http://<alertmanager-ip>:9093You should be able to see the following UI as shown below.
Setup a Prometheus AlertManager Test Alert
Execute the following statement, be sure to replace <alertmanager-ip> with the IP address / hostname of your AlertManager instance. If you are ssh'd into the AlertManager server already you can use localhost.
curl -XPOST "http://<alertmanager-ip>:9093/api/v1/alerts" \
  -d \
  "[{
    \"status\": \"firing\",
    \"labels\": {
      \"alertname\": \"Test Alert\",
      \"service\": \"test-service\",
      \"severity\":\"warning\",
      \"instance\": \"testinstance.example.com\"
    },
    \"annotations\": {
      \"summary\": \"High latency is high!\"
    }
  }]"
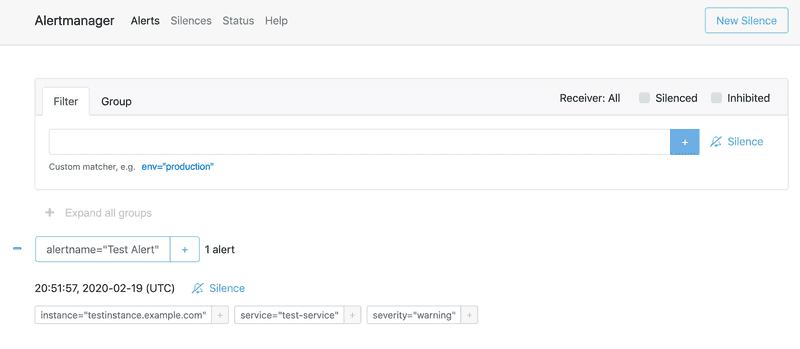
Open the AlertManager UI in a web browser
http://<alertmanager-ip>:9093You should be able to see your test alert in the UI as shown below.
Prometheus automatically takes care of sending alerts generated by its configured alerting rules, it is not recommended to generate alerts by calling the AlertManager APIs directly.
Prometheus AlertManager
Edit the alertmanager.yml file and view the current configuration.
sudo vi /etc/alertmanager/alertmanager.ymlglobal:
resolve_timeout: 5m
route:
group_by: ['alertname']
group_wait: 10s
group_interval: 10s
repeat_interval: 1h
receiver: 'web.hook'
receivers:
- name: 'web.hook'
webhook_configs:
- url: 'http://127.0.0.1:5001/'
inhibit_rules:
- source_match:
severity: 'critical'
target_match:
severity: 'warning'
equal: ['alertname', 'dev', 'instance']Restart AlertManager
sudo systemctl restart alertmanagerCurrently the only receiver that is configured is a webhook on the local machine. There are an endless number of possibilities for configuring AlertManager including sending emails, webhooks, as well as 3rd party integrations such as Slack or PagerDuty. This guide does not cover these integrations, these can be implemented separately by referencing the Prometheues documentation on Alerting Configuration.
Clean Up
Remove the download and temporary files
rm -rf alertmanager-0.21.0.linux-amd64.tar.gz alertmanager-files

